| Median assessed home value | ||
| for houses in the City of Milwaukee | ||
| nominal | real1 | |
|---|---|---|
| 1990 | $47,400 | $110,870 |
| 1991 | $47,500 | $106,121 |
| 1992 | $50,700 | $109,955 |
| 1993 | $50,800 | $106,966 |
| 1994 | $54,200 | $111,347 |
| 1995 | $54,500 | $108,657 |
| 1996 | $58,700 | $113,819 |
| 1997 | $59,100 | $112,091 |
| 1998 | $64,100 | $119,633 |
| 1999 | $64,500 | $118,059 |
| 2000 | $72,100 | $127,218 |
| 2001 | $72,600 | $124,135 |
| 2002 | $83,800 | $141,770 |
| 2003 | $89,300 | $148,187 |
| 2004 | $98,700 | $158,757 |
| 2005 | $112,300 | $176,156 |
| 2006 | $126,400 | $190,315 |
| 2007 | $127,600 | $187,084 |
| 2008 | $128,600 | $179,681 |
| 2009 | $116,700 | $165,083 |
| 2010 | $111,900 | $156,538 |
| 2011 | $112,000 | $151,376 |
| 2012 | $95,800 | $127,374 |
| 2013 | $91,800 | $119,997 |
| 2014 | $91,800 | $117,576 |
| 2015 | $91,300 | $116,726 |
| 2016 | $92,200 | $116,618 |
| 2017 | $94,500 | $117,598 |
| 2018 | $100,200 | $121,286 |
| 2019 | $102,800 | $122,413 |
| 2020 | $117,200 | $138,569 |
| 2022 | $140,000 | $144,329 |
| 1 real 2023 dollars | ||
4 Consequences of competition
4.1 Price increases
As in many cities across the country, Milwaukee’s home sales market grew very hot during the COVID-19 pandemic. Our analysis of transaction records found that about 7,300 houses were sold in self-reported arm’s length transaction during 2018.1 That grew to 7,600 in 2019 and 8,000 in 2020, before jumping all the way to 10,000 in 2021. Milwaukee began 2022 on pace to match the previous year’s total, but rapidly rising interest rates dampened demand by late summer.
1 We used Real Estate Transaction Returns (RETR) submitted to the Wisconsin Department of Revenue.
Heavy competition for available properties drove rapid price increases. Zillow’s Home Value index placed the typical Milwaukee home at $127,000 in June 2019 and $183,000 in June 2022, an increase of 44% over three years.2
2 https://www.zillow.com/milwaukee-wi/home-values/
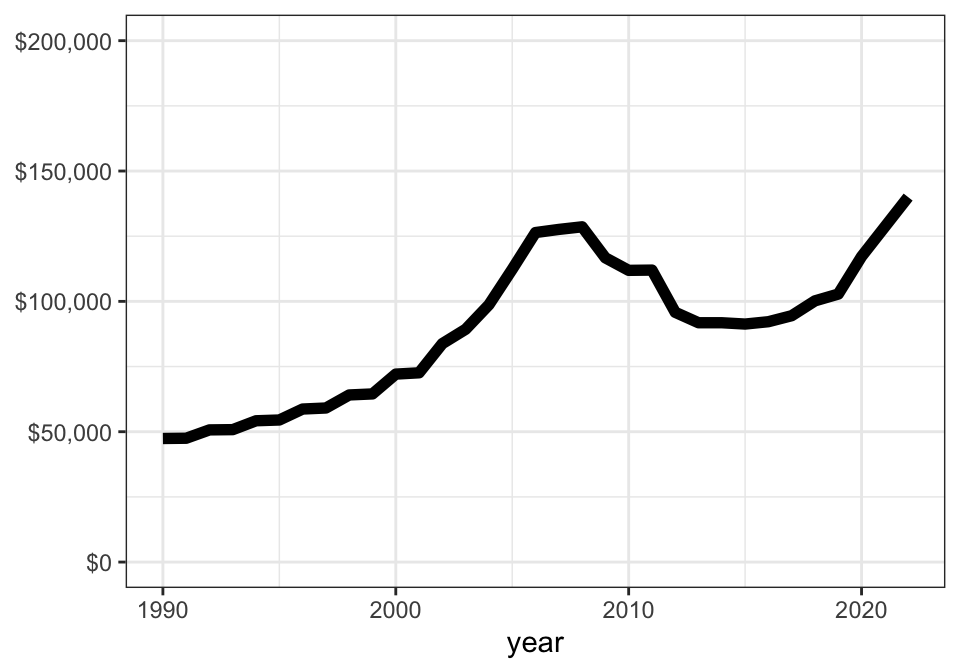
Milwaukee didn’t conduct property reassessments in 2021. In 2022, the median home was assessed at $139,900, up from $117,200 in 2020.3 Nominally, these assessments now exceed the values at the peak of the pre-housing crisis boom. In 2008, the median assessment was $128,600.
3 Assessments are based on sales data from the previous year, so 2022 assessments reflect 2021 prices.
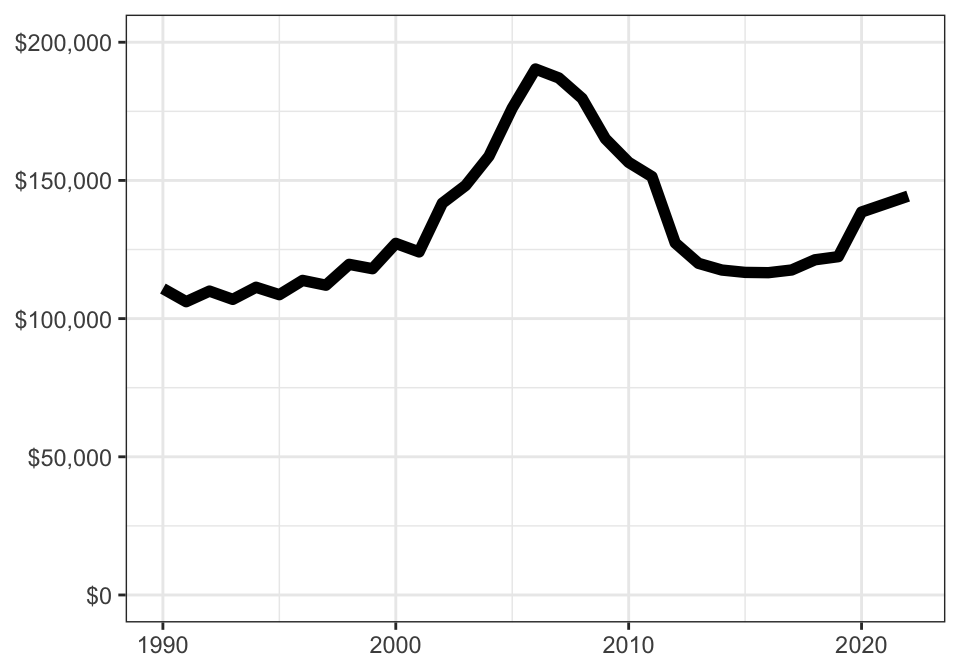
Of course, the picture is quite a bit different when adjusted for the current high-inflation environment. When applying the current value of the dollar backwards, we see that prices reached the equivalent of $186,000 in 2006. Adjusted for inflation, the jump from 2019 to 2020 was actually larger than the jump from 2020 to 2022.
4.1.1 Increases by district

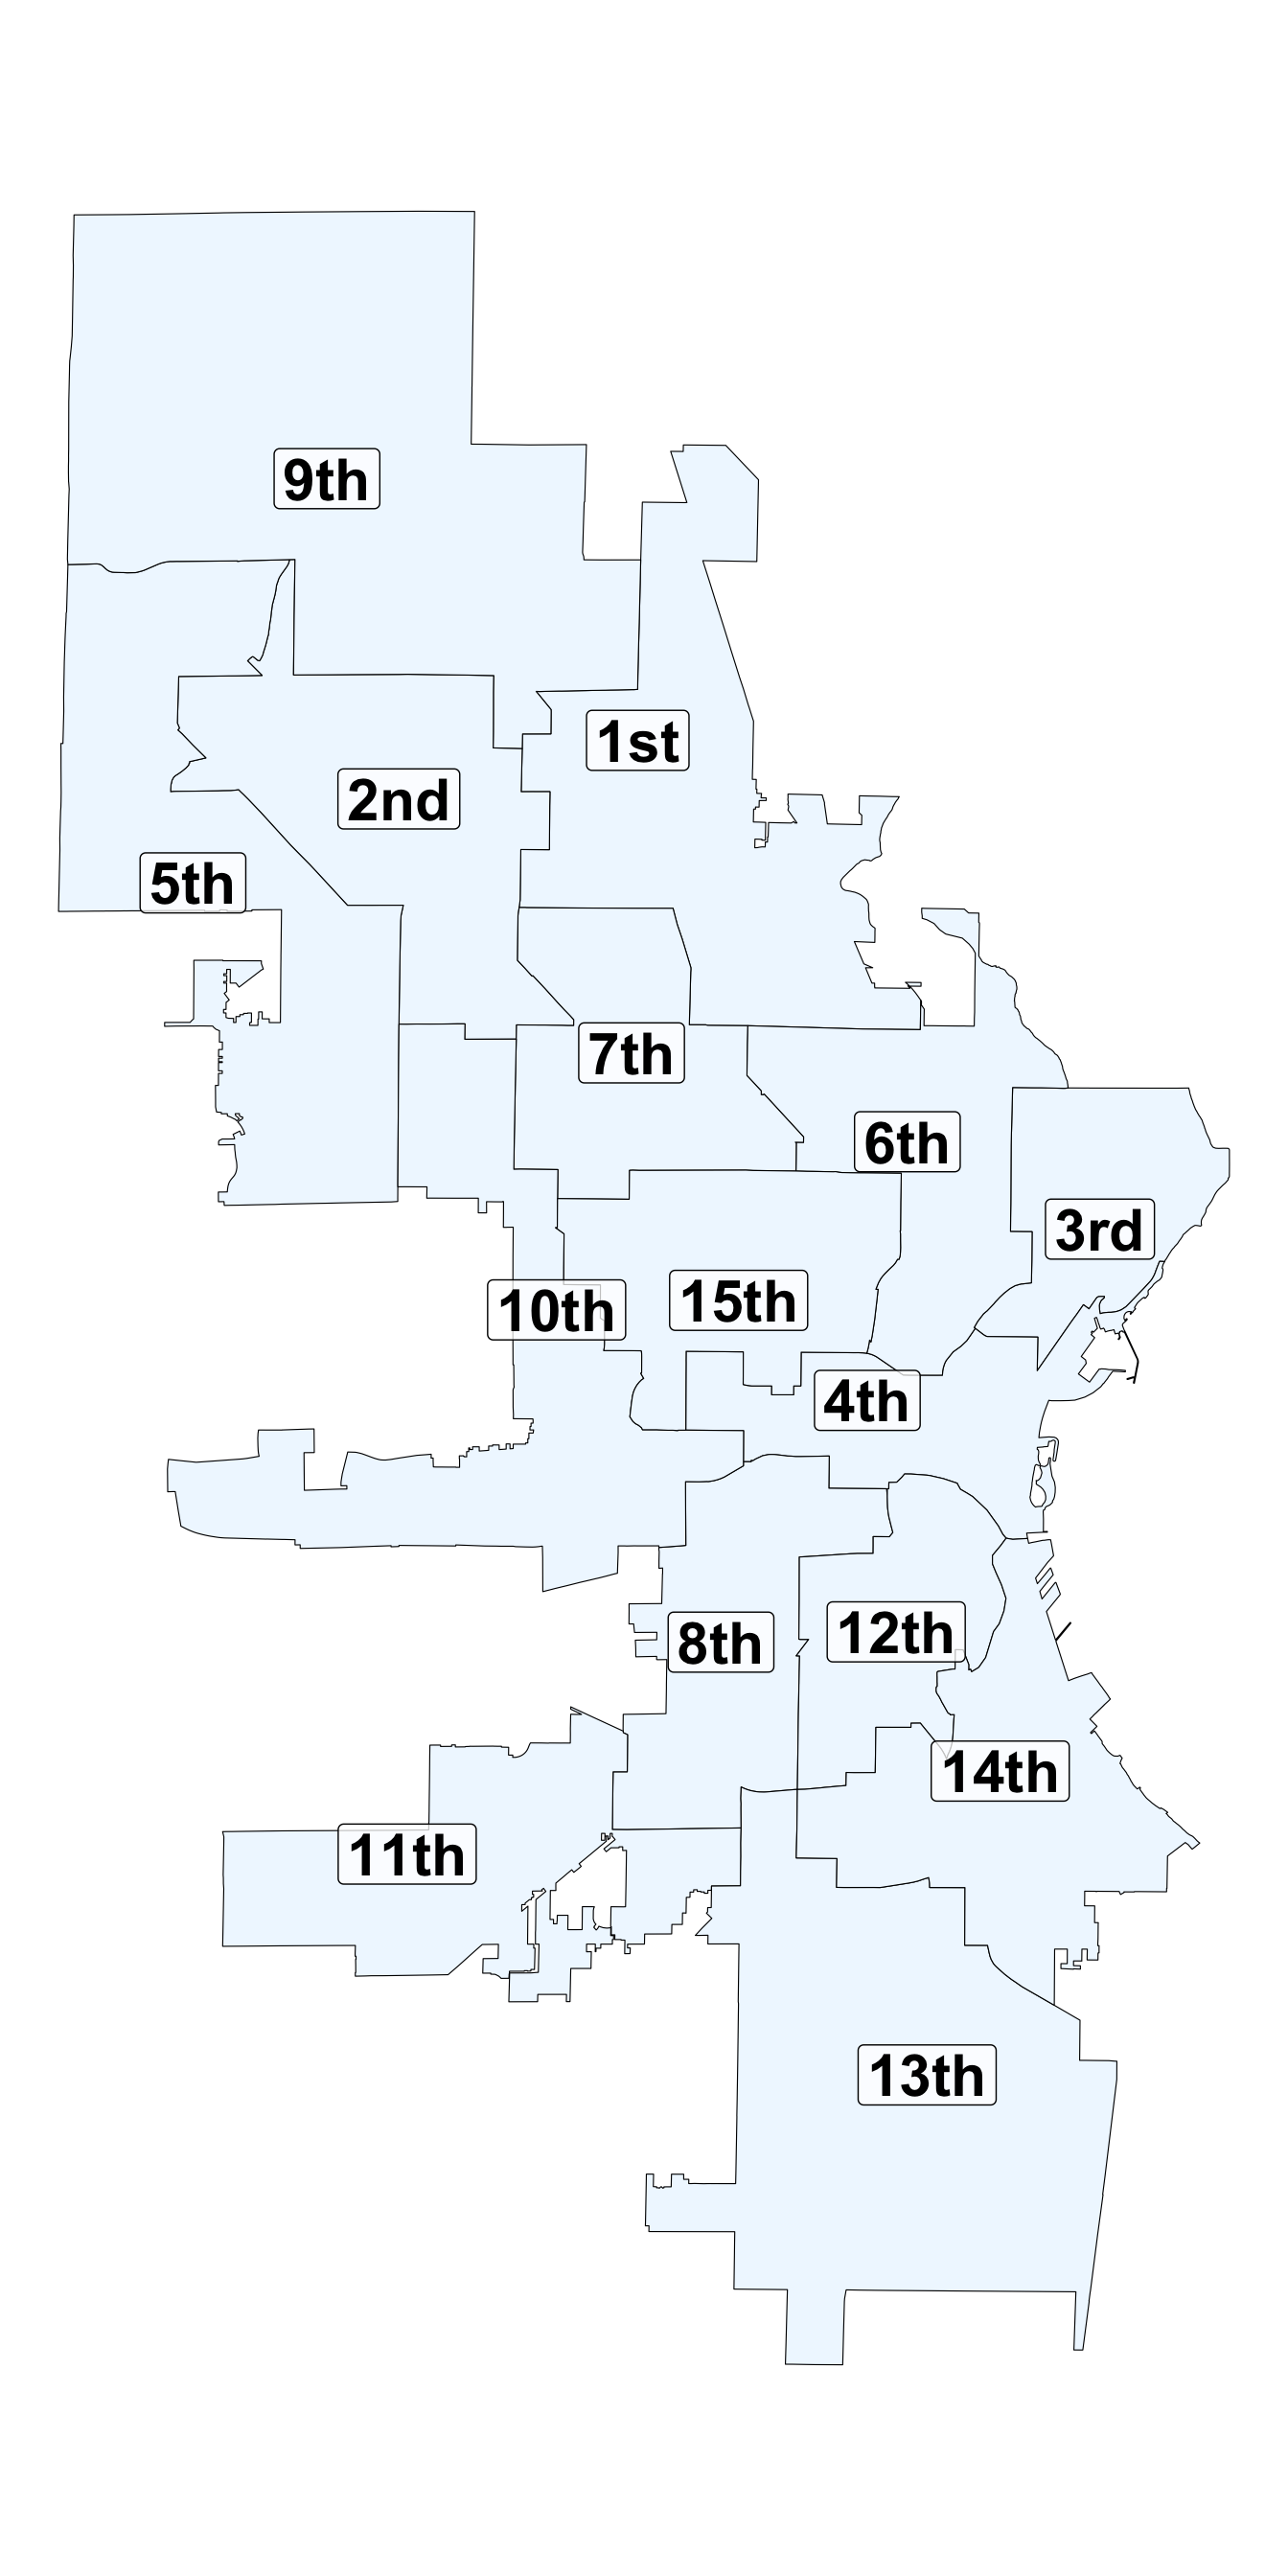
Home prices vary tremendously around the city–from a median value of $61,000 in the 15th district to a high of $270,000 in the 3rd. Median assessment increases from 2020 to 2022 ranged from a low of $15,000 in the 6th district to $28,000 in both the 2nd and 13th districts.
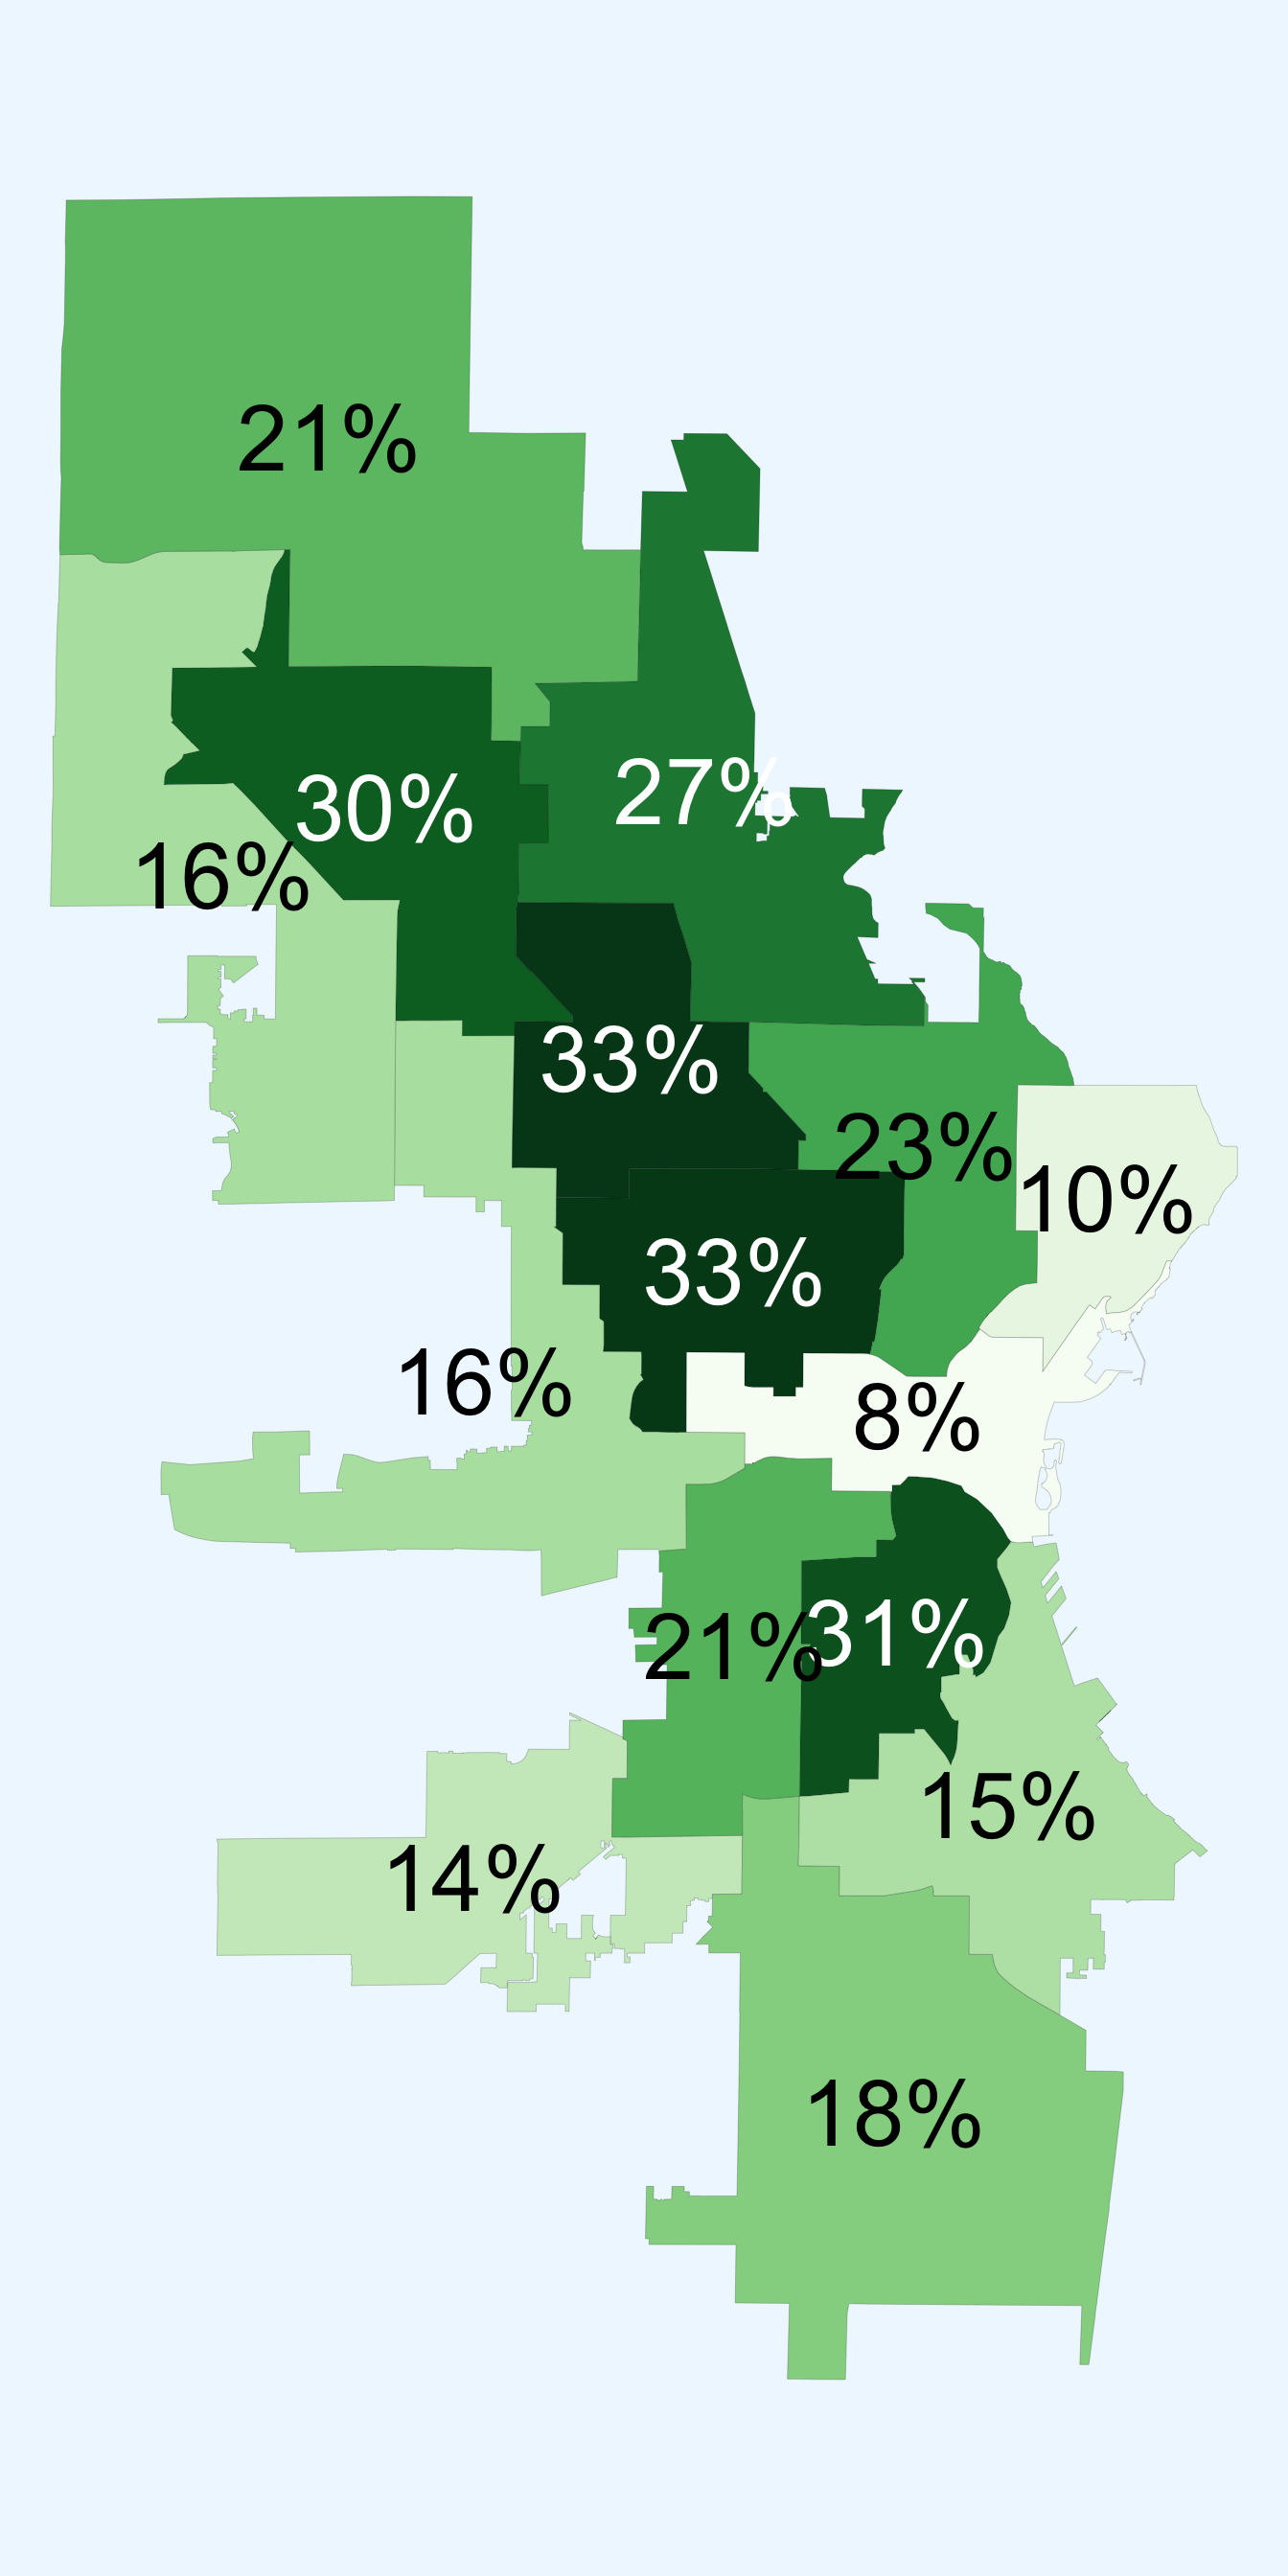
These price increases vary widely from each other in percentage terms. For example, the $18,000 increase in median assessed value in the 4th district translates to an 8% price hike. Meanwhile, the $15,000 increase in the 15th district is equivalent to a 33% price hike.
In percentage terms, median values jumped the most in the poorer neighborhoods of the city. The 12th, 15th, 7th, and 2nd districts all saw increases of 30% or more. The lowest proportional increases occurred in the two most expensive districts–the 3rd and 4th.
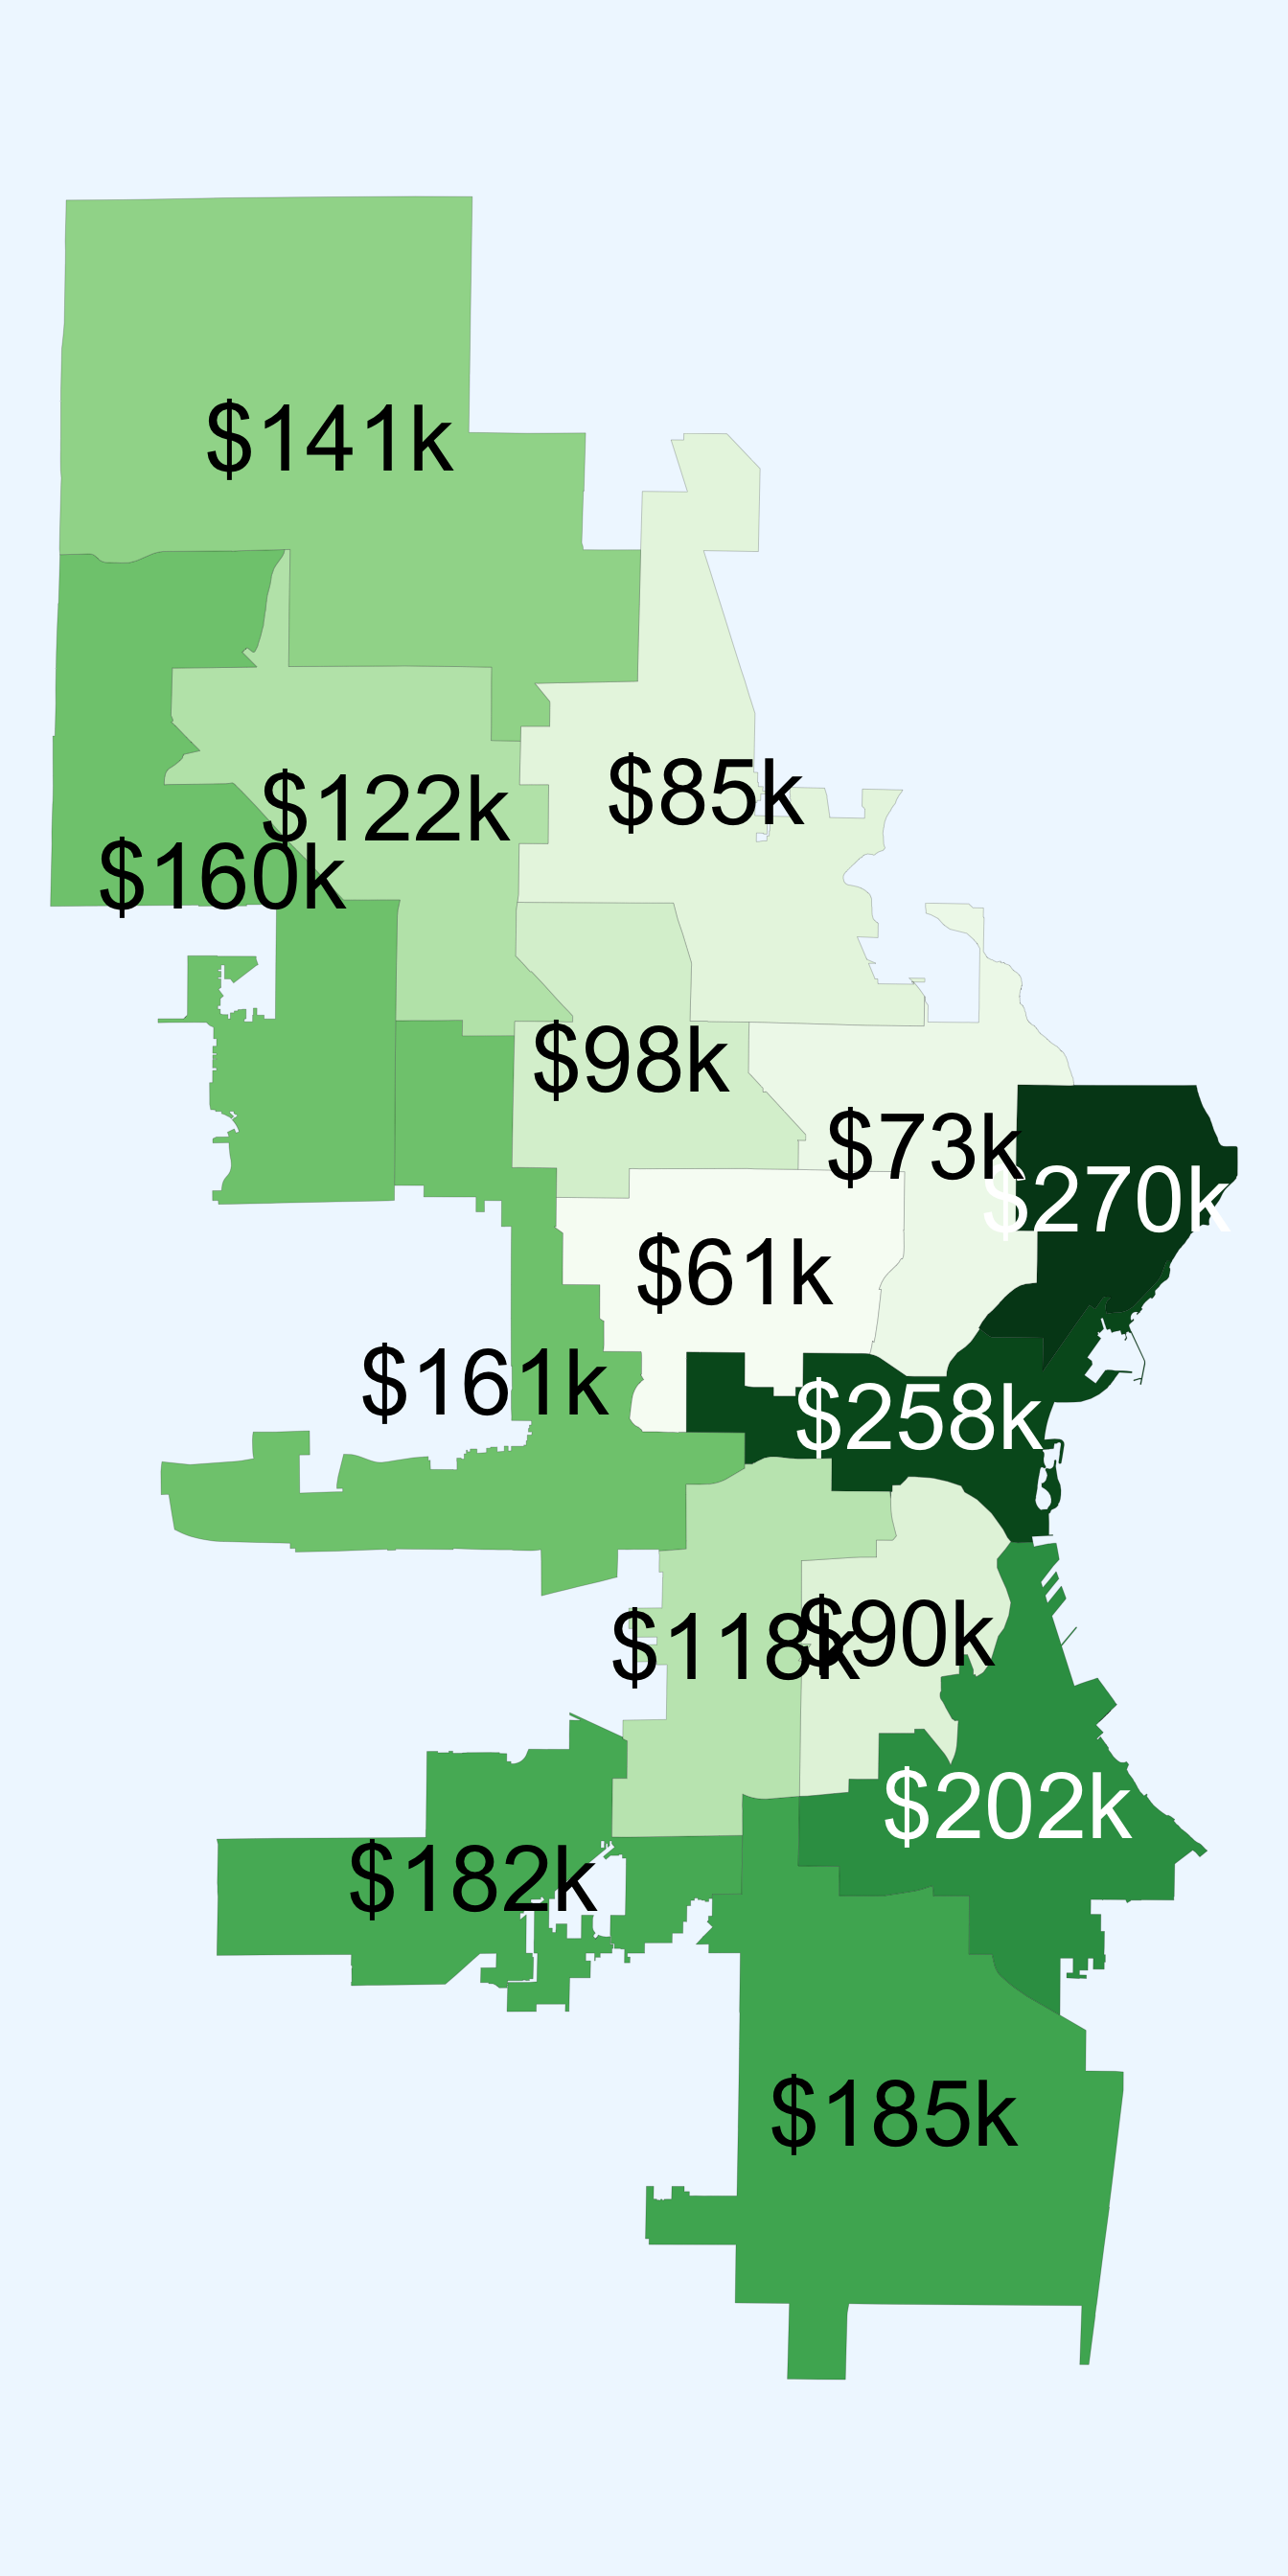
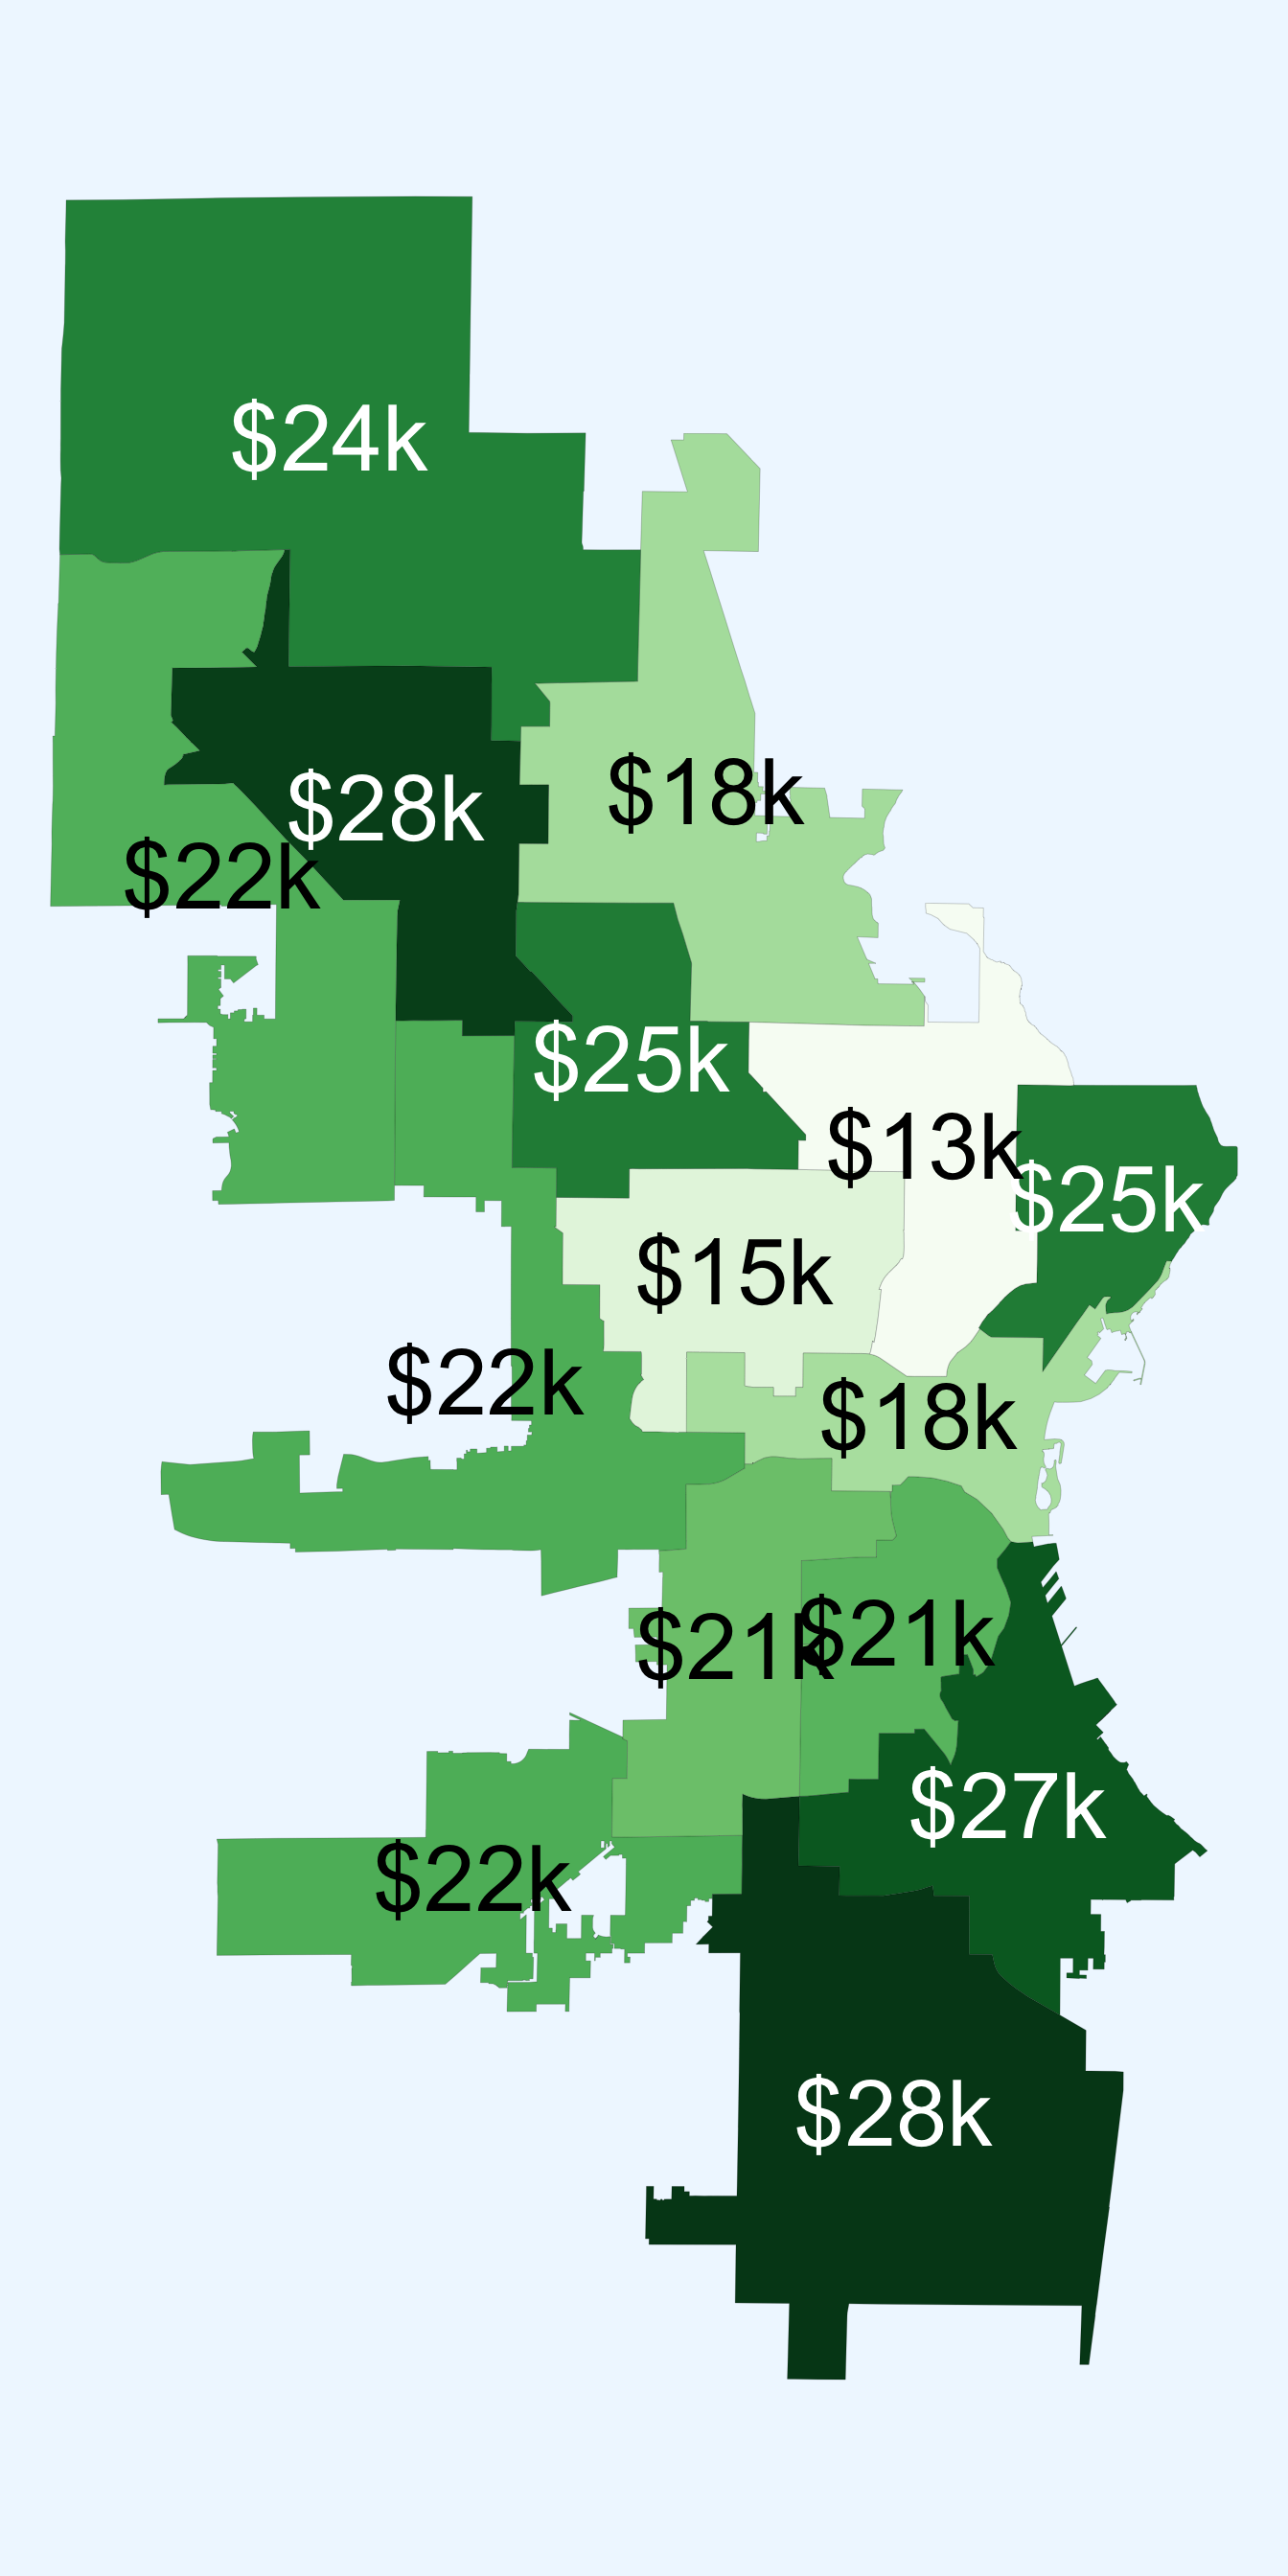
Assessed home values by district (nominal dollars)
4.2 Price distribution
The relative affordability of houses has been a bright spot in Milwaukee’s housing struggles since the Great Recession. While obviously advantageous to would-be homebuyers, this has also made Milwaukee more attractive to investors. A landlord can charge rents for a low-priced home that are comparatively higher, as a proportion of the property’s value. Existing research finds that rents are most profitable in the poorest neighborhoods of America’s poorest cities.4. 5 The flip side of this is that working class families can save significantly on a monthly basis by buying instead of renting.6
4 Demers, Andrew and Eisfeldt, Andrea L., Total Returns to Single Family Rentals (February 13, 2021). Available at SSRN
5 Desmond, Matthew and Wilmers, Nathan, “Do the Poor Pay More for Housing? Exploitation, Profit, and Risk in Rental Markets,” American Journal of Sociology 124 (4), 2019.
6 In a 2021 study, we estimated that “the average renter of a $75,000 single-family home pays about $227 more a month than it would cost to own the property.”
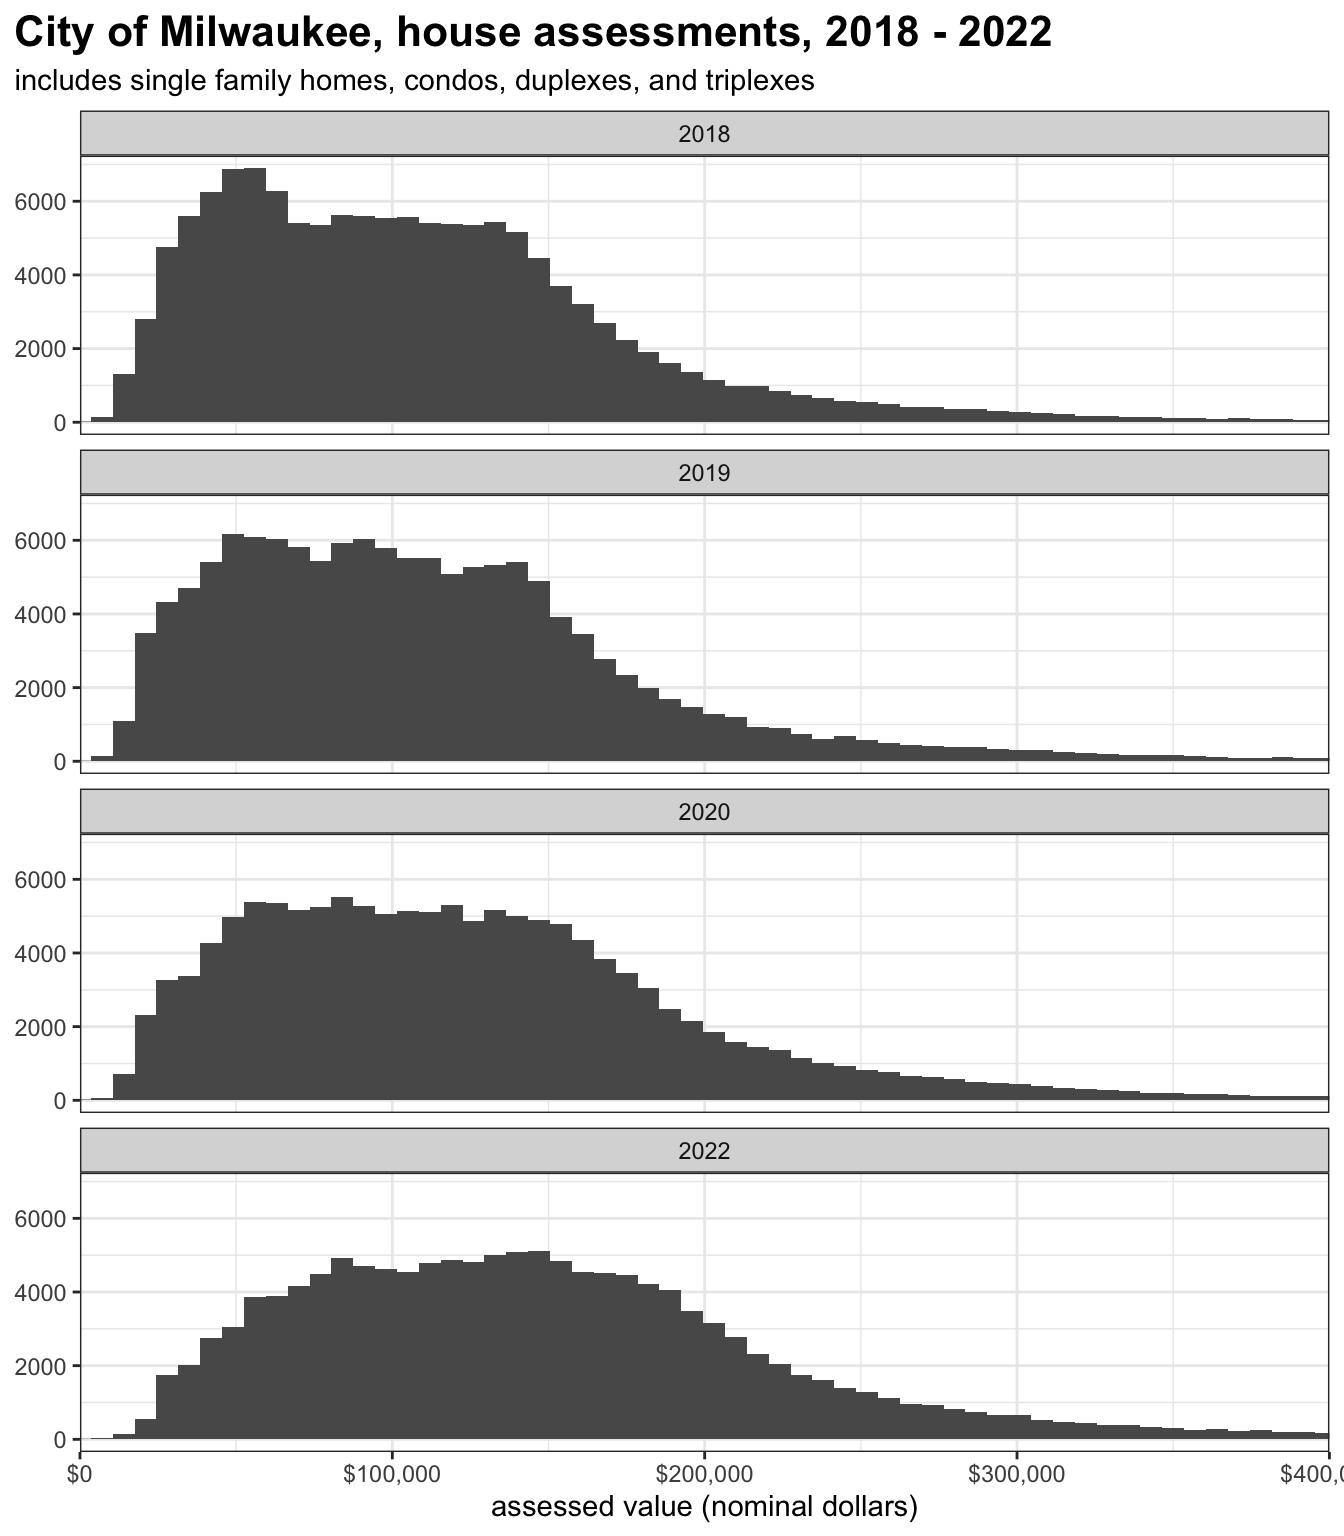
Recent increases in housing prices have reduced, but not eliminated, the pool of low-priced houses in Milwaukee.7 In 2018, half of houses were assessed below $100,000. In 2022, 30% were. The pool of homes worth less than $50k is almost gone (7% down from 19%). Twenty-six percent of homes are worth between $100,000 and $150,000, compared to 28% in 2018.
7 The following statistics are all presented in nominal dollars. Adjusting for inflation would make these differences less dramatic, but inflation is currently a quickly moving target. Also, it is not yet clear how much Milwaukee worker’s paychecks have caught up with inflation, meaning inflation-adjusted benefits to affordability may not be real for typical workers.
| Proportion of houses in each price bin | |||||
| City of Milwaukee property assessments, nominal values | |||||
| Fewer than $50k | $50k to $100k | $100k to $150k | $150k to $200k | $200k or more | |
|---|---|---|---|---|---|
| 2018 | 19% | 31% | 28% | 13% | 9% |
| 2019 | 17% | 31% | 28% | 13% | 10% |
| 2020 | 13% | 28% | 27% | 18% | 14% |
| 2022 | 7% | 23% | 26% | 23% | 22% |
| Reassessments were not conducted in 2021. | |||||
4.3 Declining local landlords
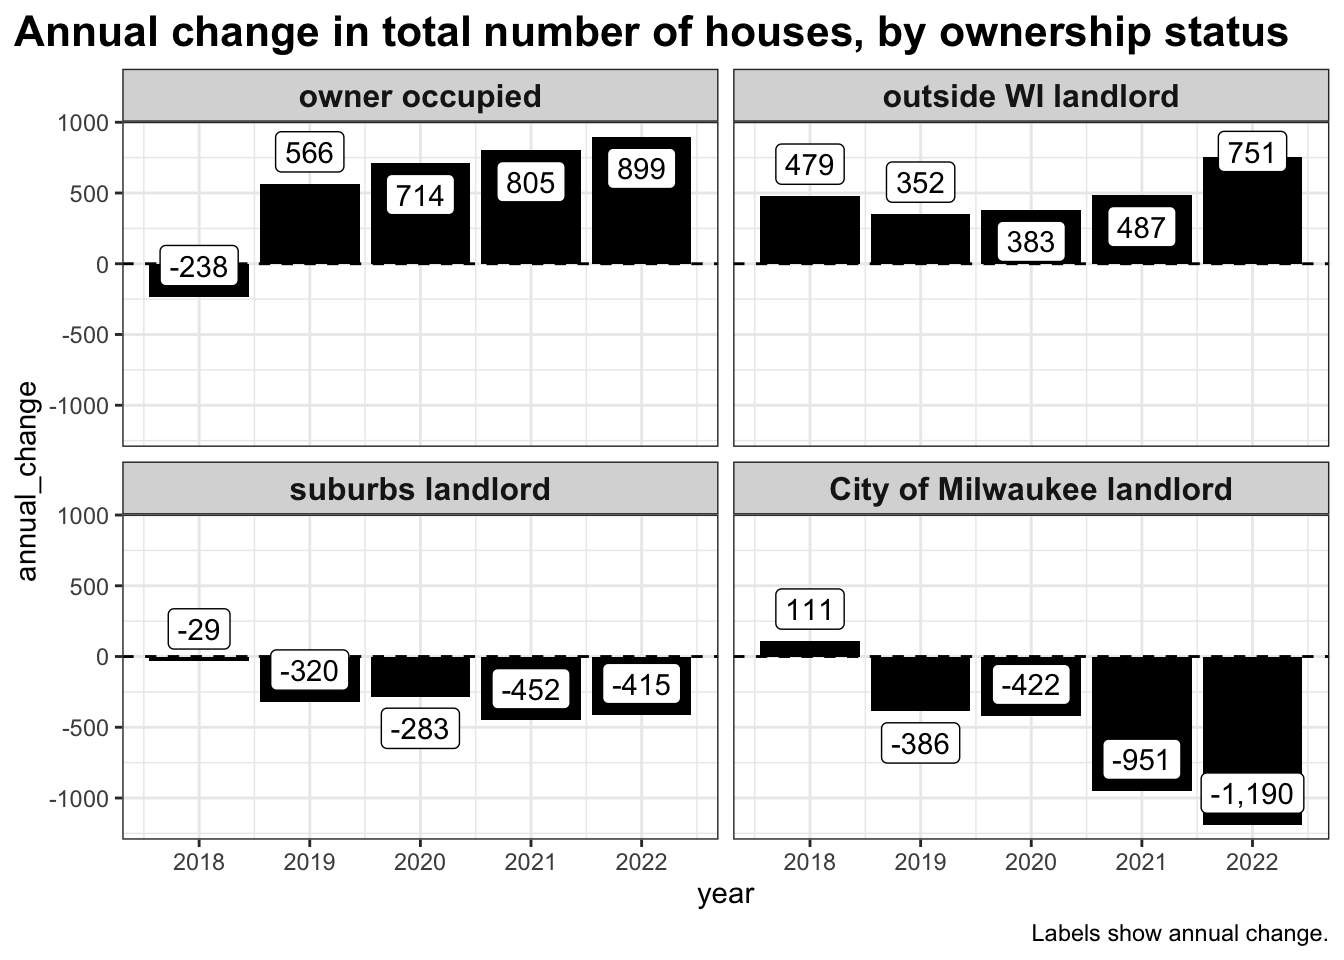
The increase in houses owned by both owner-occupiers and out-of-state investors means some class of ownership must be declining.8 The losers, in this case, are local landlords. Since 2018, the number of properties owned by a landlord based in the Milwaukee suburbs fell by 1,470. Ownership by landlords based in the City of Milwaukee fell by 2,949.
8 Aside from some condo developments, few new houses are built in Milwaukee. Recall that this study focuses on houses–meaning single family homes, condos, duplexes, and triplexes–not apartment buildings.
The pace of these changes appears to be accelerating. The graph below shows annual changes in the number of houses owned by each class of owner. The value for 2022 is through December
Already, in fall 2022, the number of houses acquired by an out-of-state landlord exceeds the number acquired in all of 2021, as have the number bought by an owner-occupier.
4.4 Owner-occupiers vs. investors
During the Housing Crisis, investors with ready access to cash gobbled up enormous numbers of previously owner-occupied homes at bargain prices. Many of these properties underwent formal foreclosure, but others were purchased from distressed owners before things got that far–hence the proliferation of “We buy houses” signs on light poles in struggling neighborhoods across American cities.
While that dynamic explains the burst in out-of-state ownership during the early and mid-2010s, it is not what is happening in Milwaukee’s housing market now. Instead, both owner-occupancy and out-of-state investment are increasing simultaneously.
As discussed in Section 3, the bulk of out-of-state investment is currently occurring in about 1/3rd of the city, specifically the 1st, 2nd, 6th, 7th, and 15th districts. The other west and north side districts are also experiencing a more limited amount of investor activity. Collectively, these districts have also seen significant growth in owner-occupancy. These are among the city’s most affordable neighborhoods for aspiring working class homeowners. Because property values are relatively low, they are also among the most profitable investments for landlords.
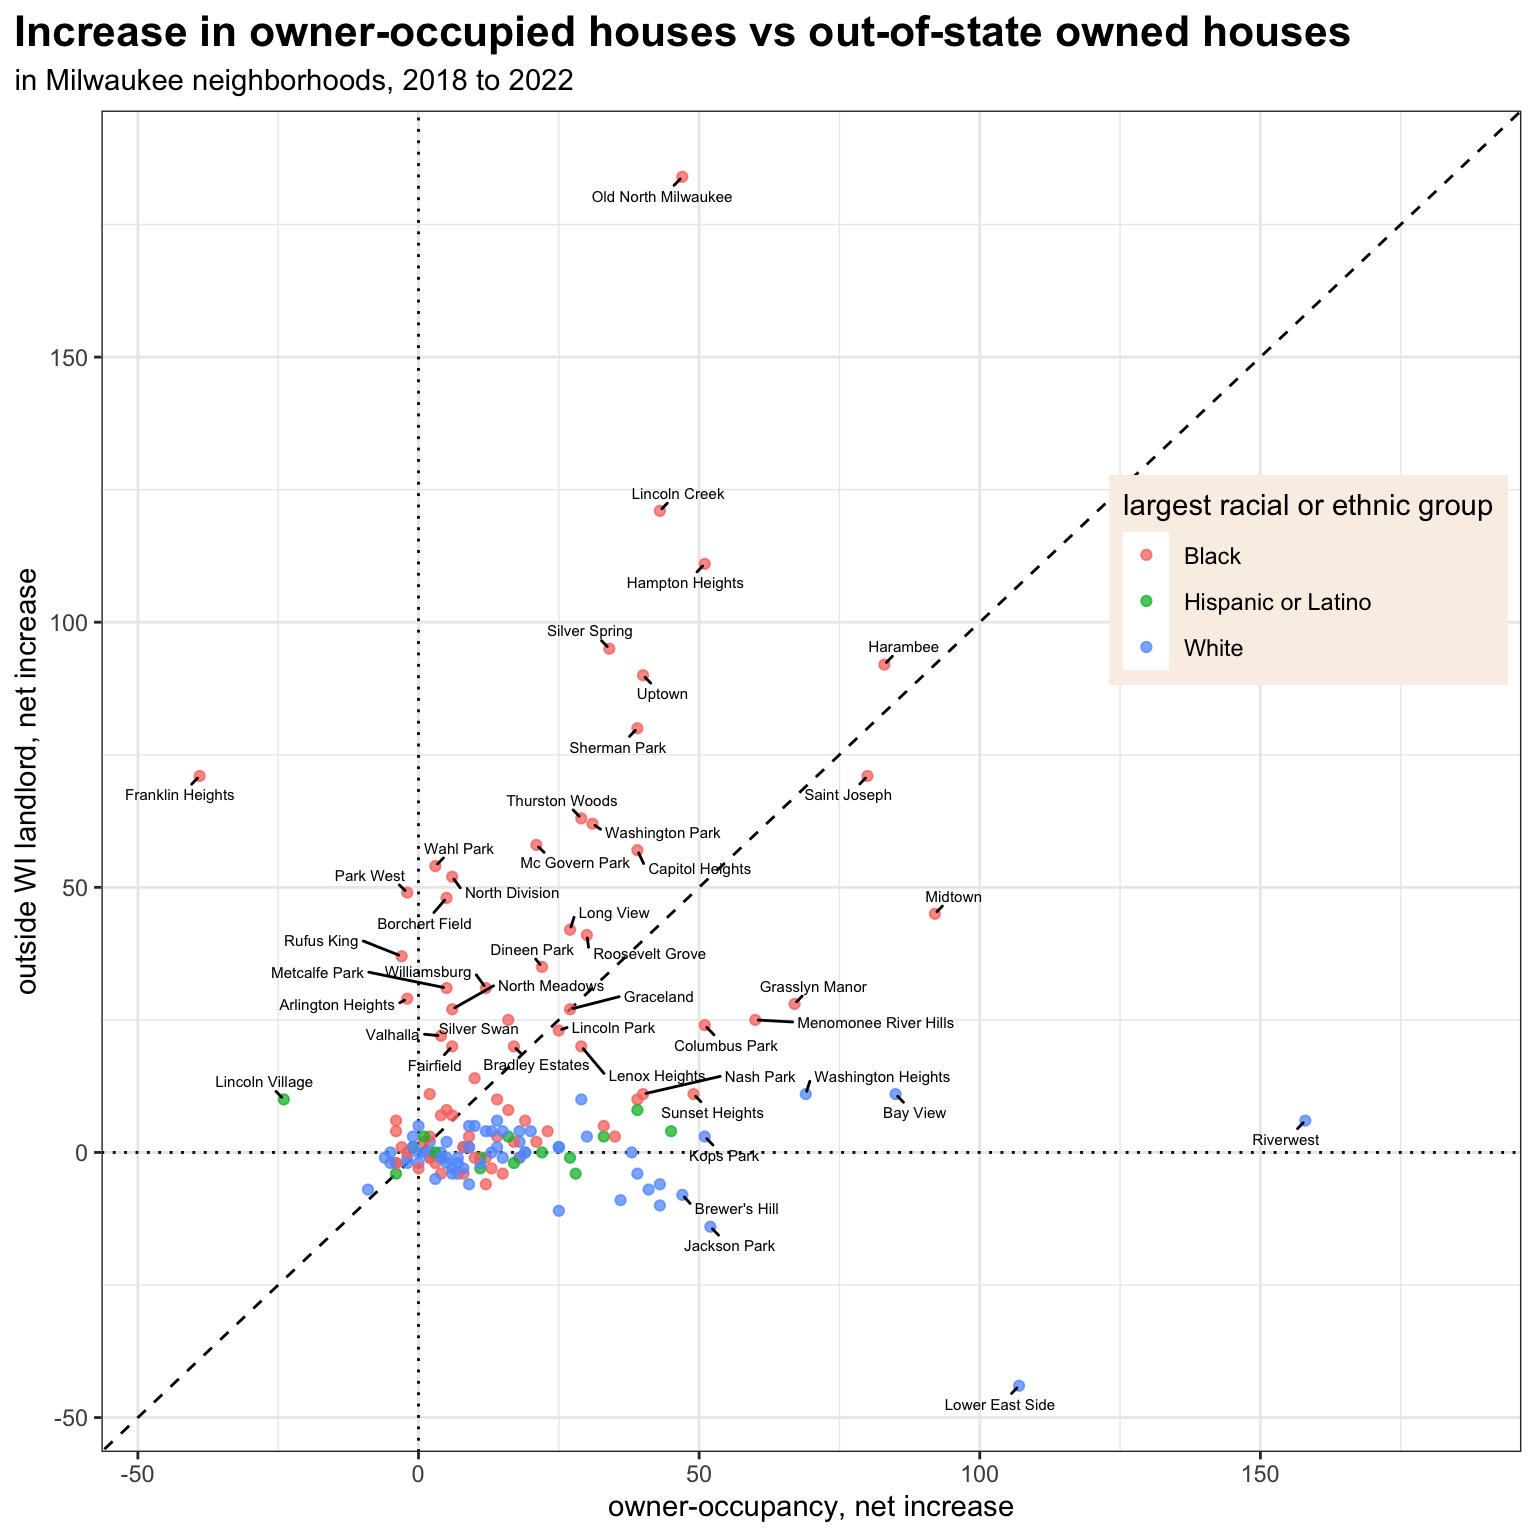
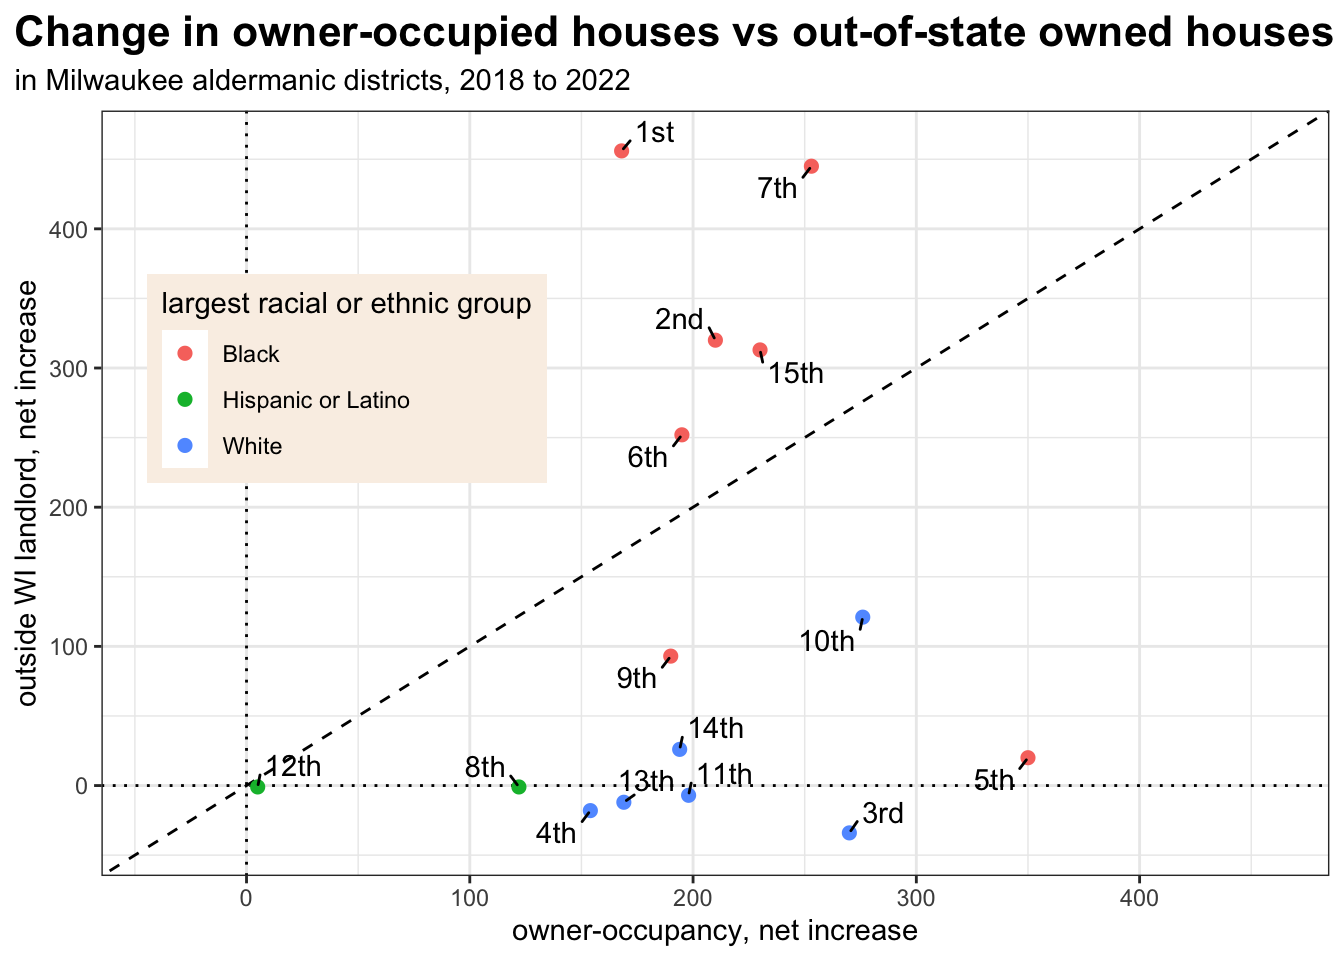
This dynamic places would-be homeowners and private equity backed investors in direct competition for the same kinds of properties in many of the same neighborhoods. The graph below shows the change, from 2018 to 2022, in the number of owner occupied houses vs. houses owned by an out-of-state landlord in each district.
- The 12th district alone has experienced little change in either category.
- Another set of districts has seen growth in owner occupation, but little change in out-of-state investment. These include the 3rd, 4th, 5th, 8th, 11th, 13th, and 14th districts.
- The 1st and 7th districts have seen a sharp increase in out-of-state investment–far exceeding their more modest increases in owner-occupiers.
- The final set of districts is seeing significant growth in both categories.
- Growth in owner-occupation and out-of-state investment is closely matched in the 6th district.
- Investors have a slight edge in the 2nd and 15th districts.
- Owner-occupiers are outpacing investors in the 9th and 10th districts.
The following graph presents the same data by neighborhood.
- Neighborhoods including Murray Hill, Jackson Park, Brewer’s Hill, the Lower East Side, and Riverwest have all experienced owner-occupancy growth along with essentially no growth, or even a decline, in out-of-state investment.
- Owner-occupancy growth has substantially outstripped investment in Kops Park, Polonia, Washington Heights, and Bay View.
- Neighborhoods including Lincoln Village, Arlington Heights, Rufus King, Borchert Field, Wahl Park, and Franklin Heights have seen little or no increase in owner occupancy, but they have seen more properties acquired by out-of-state investors.
- Old North Milwaukee, Lincoln Creek, and Silver Spring have seen large amounts of out-of-state investment–far exceeding owner-occupancy growth.
- Owner occupiers and investors are competing in Capitol Heights, Washington Park, Thurston Woods, Sherman Park, Uptown, Saint Joseph, and Harambee. But in these neighborhoods, investors have acquired more than owner-occupiers in the last few years.
- The reverse is true in Nash Park, Sunset Heights, Menomonee River Hills, Grasslyn Manor, and Midtown. Here, there is significant investor activity, but even more growth among owner occupiers.