
3 Investor Activity
Out-of-state investors have continued their rapid acquisition of Milwaukee homes in recent years, even as purchases by local landlords have tapered off. As of December 2022, they own 7,219 single family homes, duplexes, condos, or triplexes across the city, up from 5,246 at the end of 2018. This category of ownership has grown by 51% since 2017 and 479% since 2005.
The share of rented houses owned by an out-of-state landlord has grown from about 5% in 2005 to 18% in 2022. Meanwhile, the share owned by a landlord located in the City of Milwaukee has fallen from 63% to 46%. Today, more than 1-in-6 Milwaukee rental homes are owned by a landlord based outside Wisconsin.
| Milwaukee houses by ownership status | ||||
| owner occupied | landlord | |||
|---|---|---|---|---|
| Milwaukee | outside WI | suburbs | ||
| 2008 | 104,874 | 17,849 | 2,332 | 8,850 |
| 2009 | 103,208 | 18,780 | 2,450 | 9,801 |
| 2010 | 101,580 | 19,109 | 2,754 | 10,185 |
| 2011 | 99,732 | 19,593 | 3,064 | 10,817 |
| 2012 | 97,343 | 20,077 | 3,687 | 11,659 |
| 2013 | 95,648 | 20,099 | 3,811 | 12,219 |
| 2014 | 94,685 | 20,209 | 3,969 | 12,544 |
| 2015 | 93,390 | 20,629 | 4,399 | 12,988 |
| 2016 | 92,467 | 20,976 | 4,579 | 13,479 |
| 2017 | 92,375 | 21,266 | 4,767 | 13,248 |
| 2018 | 92,137 | 21,377 | 5,246 | 13,219 |
| 2019 | 92,703 | 20,991 | 5,598 | 12,899 |
| 2020 | 93,417 | 20,569 | 5,981 | 12,616 |
| 2021 | 94,222 | 19,618 | 6,468 | 12,164 |
| 2022 | 95,121 | 18,428 | 7,219 | 11,749 |
3.1 Out-of-state investors target majority Black neighborhoods
Recent out-of-state investment has almost exclusively targeted majority Black neighborhoods across the city. Out-of-state landlords ended 2022 owning 24% of rental houses in majority Black wards–a 9.3 percentage point leap since just 2018. From 2018 through 2022, the number of out-of-state owned houses in majority white neighborhoods fell by nearly 100. For majority-Black neighborhoods, it grew by over 1,900. Majority Hispanic or Latino neighborhoods saw relatively little activity by these investors.
| Houses owned by out-of-state landlords, by racial or ethnic majority group of ward | ||||||
| in City of Milwaukee wards | ||||||
| Black | White | Hispanic or Latino | ||||
|---|---|---|---|---|---|---|
| pct1 | parcels | pct1 | parcels | pct1 | parcels | |
| 2006 | 5.5% | 803 | 6.3% | 372 | 3.7% | 146 |
| 2010 | 7.9% | 1,461 | 11.2% | 822 | 5.6% | 262 |
| 2014 | 11.4% | 2,139 | 14.4% | 1,173 | 6.7% | 321 |
| 2018 | 14.7% | 3,276 | 14.3% | 1,215 | 7.1% | 390 |
| 2022 | 24.0% | 5,222 | 14.7% | 1,134 | 7.5% | 404 |
| 2011 wards are used, with demographics drawn from the 2020 census. | ||||||
| 1 Share of all landlord-owned houses which are owned by an out-of-state landlord | ||||||
3.2 Aldermanic districts
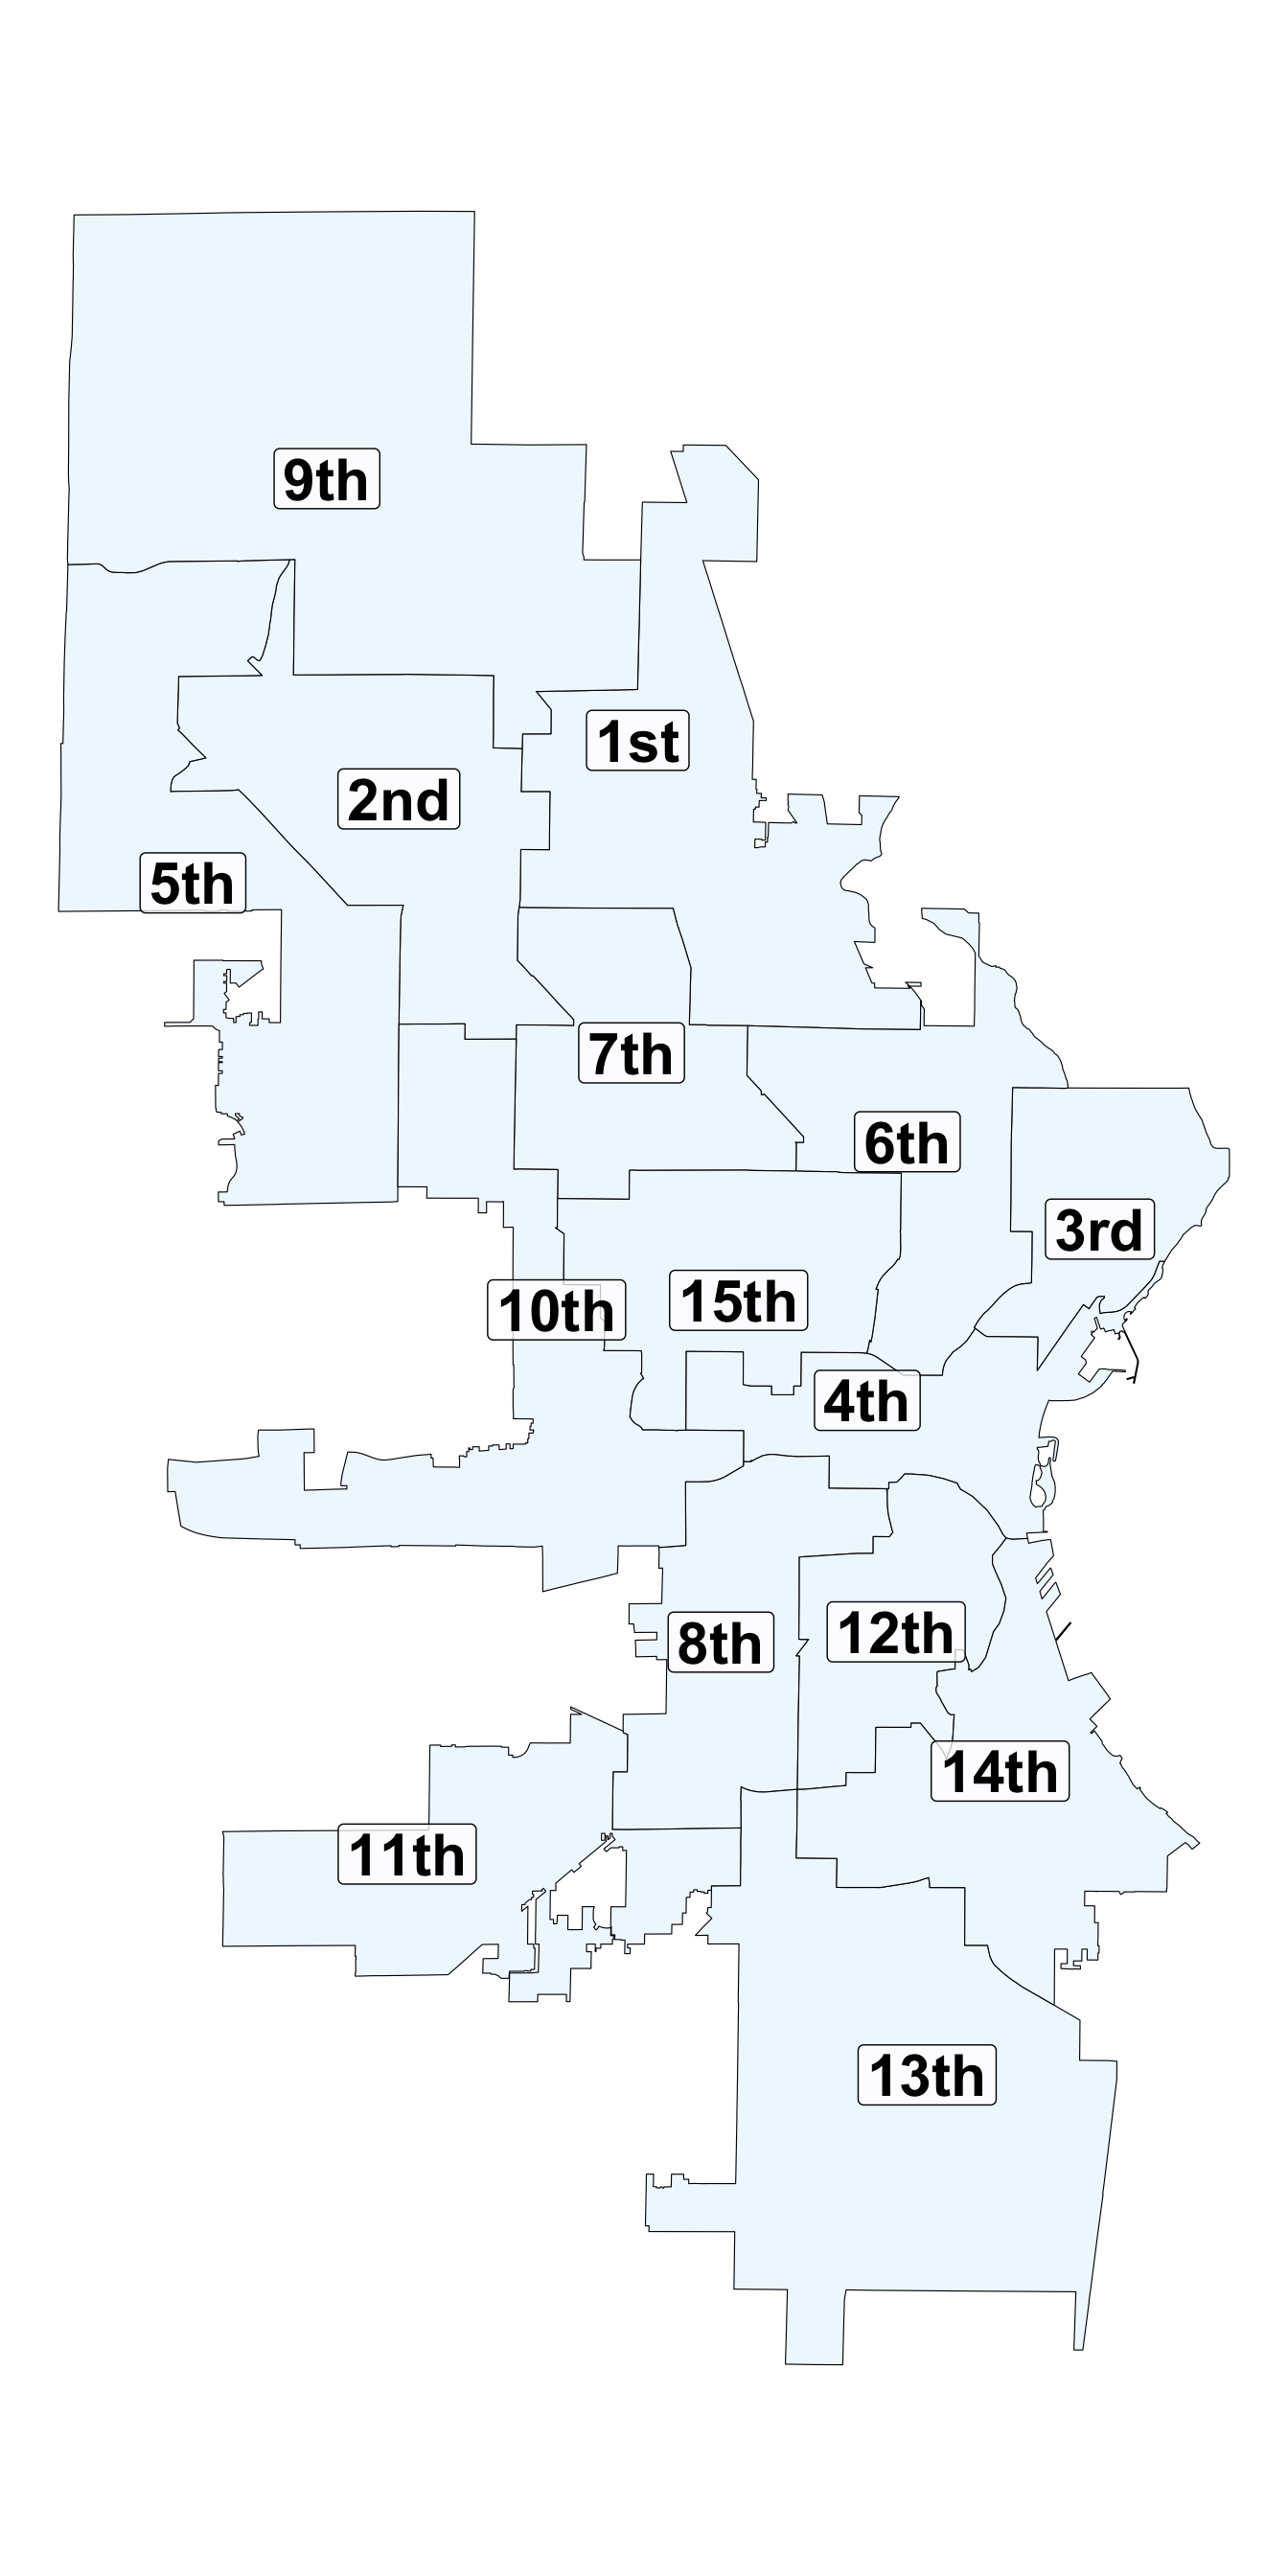

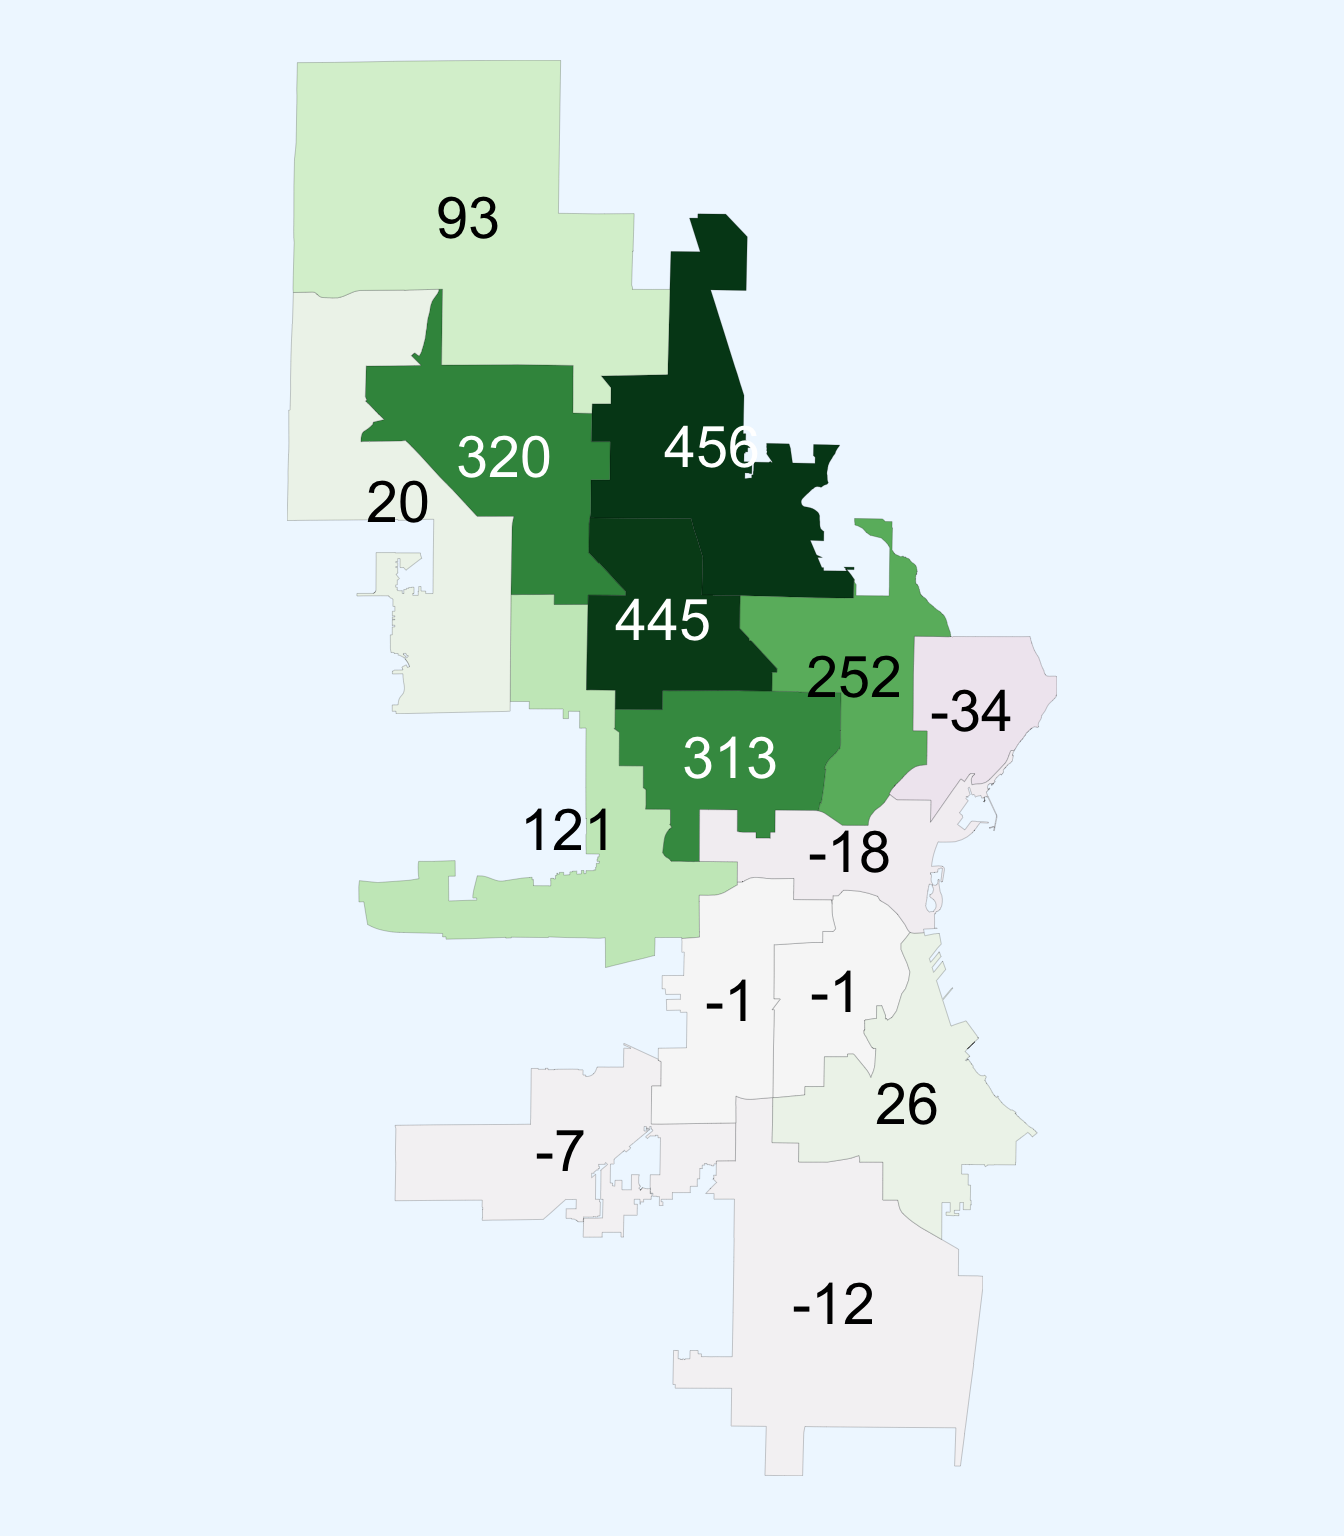
Recent growth in out-of-state investment is concentrated in a third of the city’s 15 aldermanic districts–all on the north side.
In the 7th district, 1,100 houses are owned by an out-of-state landlord, an increase of 445 since 2018. Similarly, in the adjacent 1st district, 1,090 houses are owned by an out-of-state landlord, an increase of 456 since 2018. The 2nd, 15th, and 6th districts complete this cluster, where out-of-state ownership totals 819, 795, and 764, respectively.
Across all 5 of these districts combined, 4,568 houses are now owned by out-of-state investors. This is a 64% increase since 2018.
The 9th, 5th, and 10th districts (encompassing the northern and western fringe) saw a more limited increase in out-of-state investment. This category of ownership grew from 1,031 in 2018 to 1,265 in 2022, an increase of 23%.
The rest of the city has seen little out-of-state investment in recent years. In fact, the number of properties owned by a landlord outside Wisconsin outright declined in the 3rd, 4th, 8th, 11th, 12th, and 13th districts.


3.3 Major investors
Just three companies account for 20% of all out-of-state owned rental properties in 2022. In 2018, they owned just 2%. Collectively, VineBrook Homes, Highgrove Holdings, and SFR3 own 1,452 houses as of December 2022, compared to 83 at the end of 2018.1
1 These figures are based on city tax records maintained by the Assessor’s Office and may not include the most recent transactions.
All three of these private equity backed companies were profiled in the spring of 2021 by the Lubar Center and the Milwaukee Journal Sentinel. Since then, they’ve rapidly expanded their portfolios across the city.
| Portfolios of the largest out-of-state investors | ||||
| in Milwaukee's house rental market | ||||
| total | Highgrove Holdings | SFR3 | VineBrook Homes | |
|---|---|---|---|---|
| 2015 | 1 | 1 | 0 | 0 |
| 2016 | 11 | 11 | 0 | 0 |
| 2017 | 17 | 17 | 0 | 0 |
| 2018 | 83 | 25 | 58 | 0 |
| 2019 | 138 | 36 | 61 | 41 |
| 2020 | 461 | 116 | 95 | 250 |
| 2021 | 902 | 268 | 148 | 486 |
| 1 2022 | 1,452 | 269 | 239 | 944 |
| 1 All statistics are year-end totals. | ||||
SFR3 and VineBrook both primarily target single family rental properties with a typical value of about $100,000. Highgrove’s investments follow a different profile. Instead, Highgrove buys mostly duplexes with a median value near $50,000.
| Portfolios of Milwaukee's 3 largest out-of-state landlords | |||||
| as of December 2022 | |||||
| total | median value | property types | |||
|---|---|---|---|---|---|
| duplex | single family | triplex+ | |||
| Highgrove Holdings | 269 | $48,600 | 143 | 116 | 10 |
| SFR3 | 239 | $93,600 | 41 | 197 | 1 |
| VineBrook Homes | 944 | $103,750 | 38 | 906 | 0 |
3.3.1 locations
Aside from a thin scattering of properties across the south side, each of these landlords focuses overwhelmingly on the north side. Their preferences for different property types and price points result in VineBrook and SFR3 targeting one set of neighborhoods, while Highgrove primarily invests in another.
Nearly all of VineBrook and SFR3’s properties are north of Capitol Drive and/or west of 35th Street. They both also own a few properties in and around Harambee.
Highgrove’s properties mostly fall within the near north side–south of Capitol, east of Sherman Boulevard, and west of Holton Street.
locations of houses owned by Highgrove Holdings, SFR3, and VineBrook Homes in 2022